PROJECT DATA
View project data
It is possible to view as maps (when the data allows it) the data produced within the activities of the project. The maps are organized in themes (A1, A2, C1, C2, C7, C8, C10) each one of them is related to a specific ACTION of the project.
You can also REGISTER in the map viewer platform to get access to additional and/or more detailed maps.
How to use the map viewer
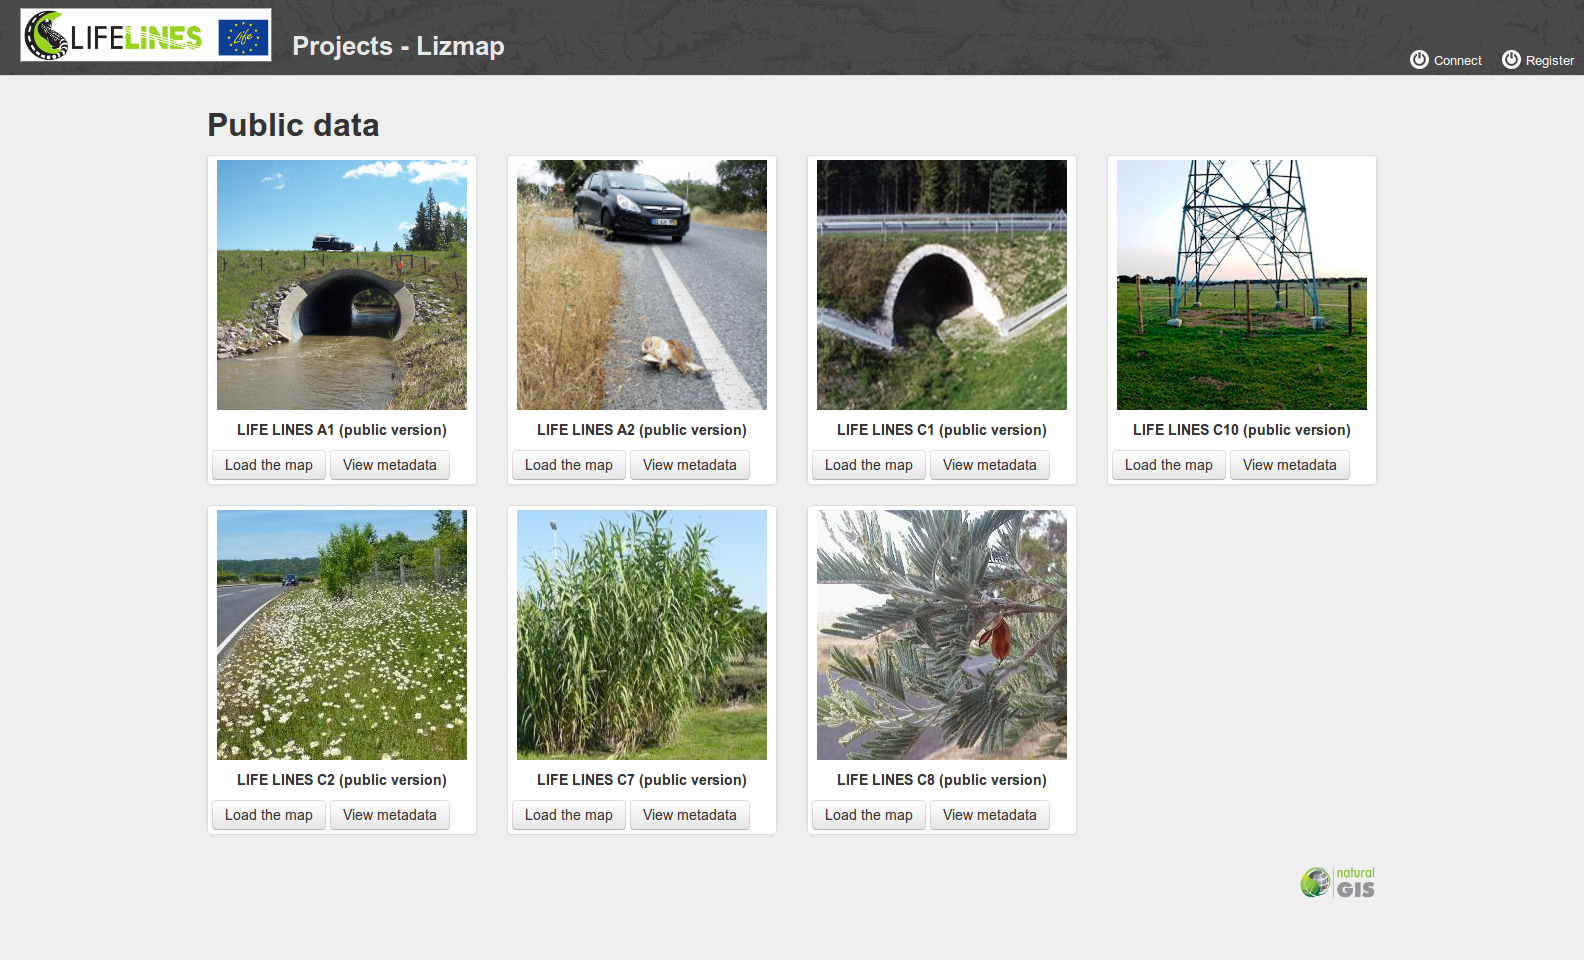
Step1, the landing page: The viewer LANDING PAGE will show you a series of images, each one links to a different set of maps where each set is about a specific project ACTION. On the top right corner of the landing page you will find the links to register in this platform (and gain access to extra and/or more detailed maps) or to login in case you already have a credential.
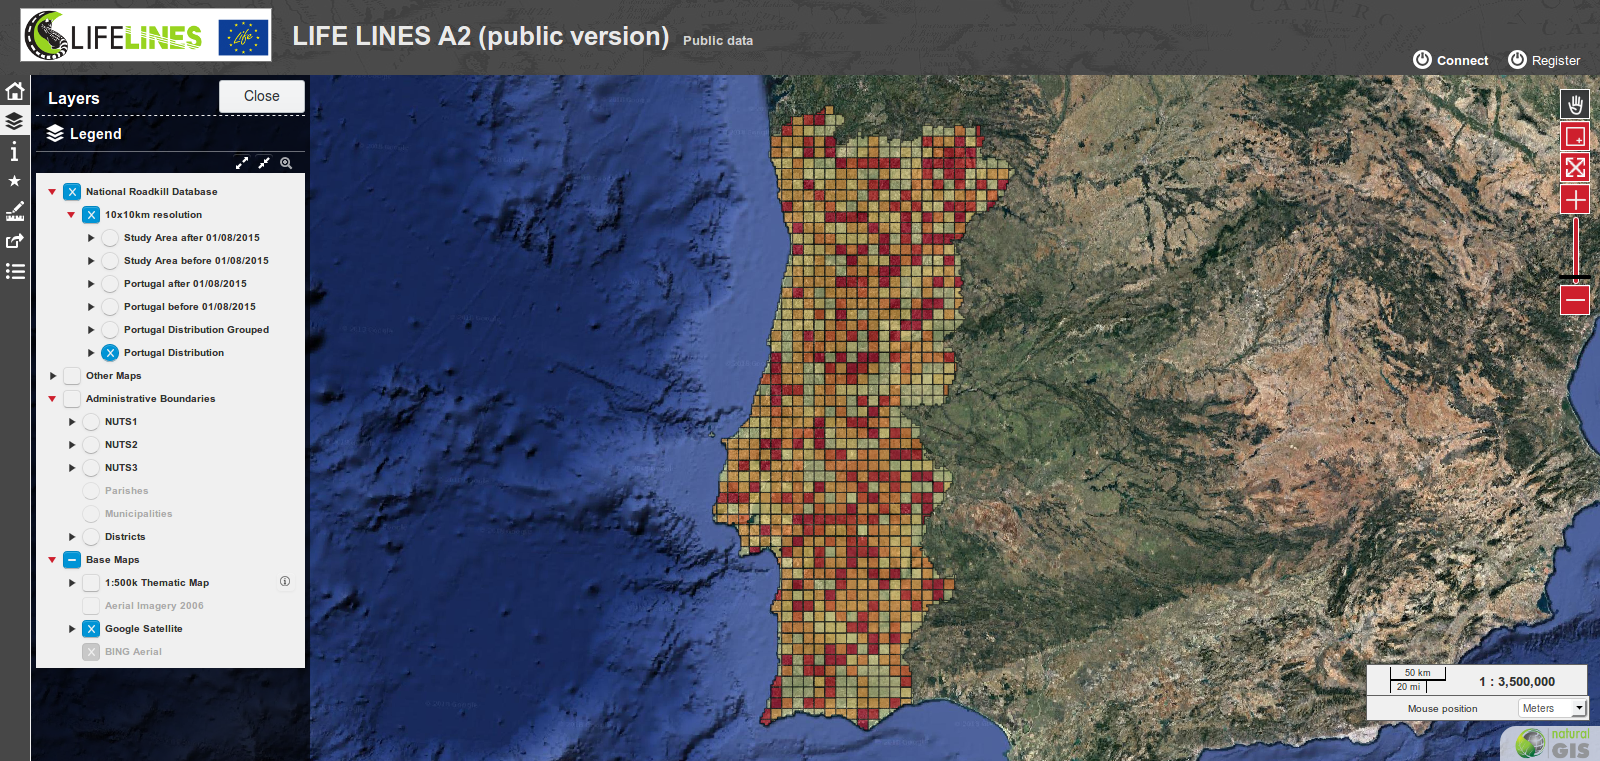
Step2, the map viewer: The map viewer itself has the typical structure of any WebGIS application. There are two vertical toolbars (one on the right and one on the left) and a vertical panel (on the left in this case) presenting a list of GROUPS and LAYERS that the user can TOGGLE/UNTOGGLE at will.
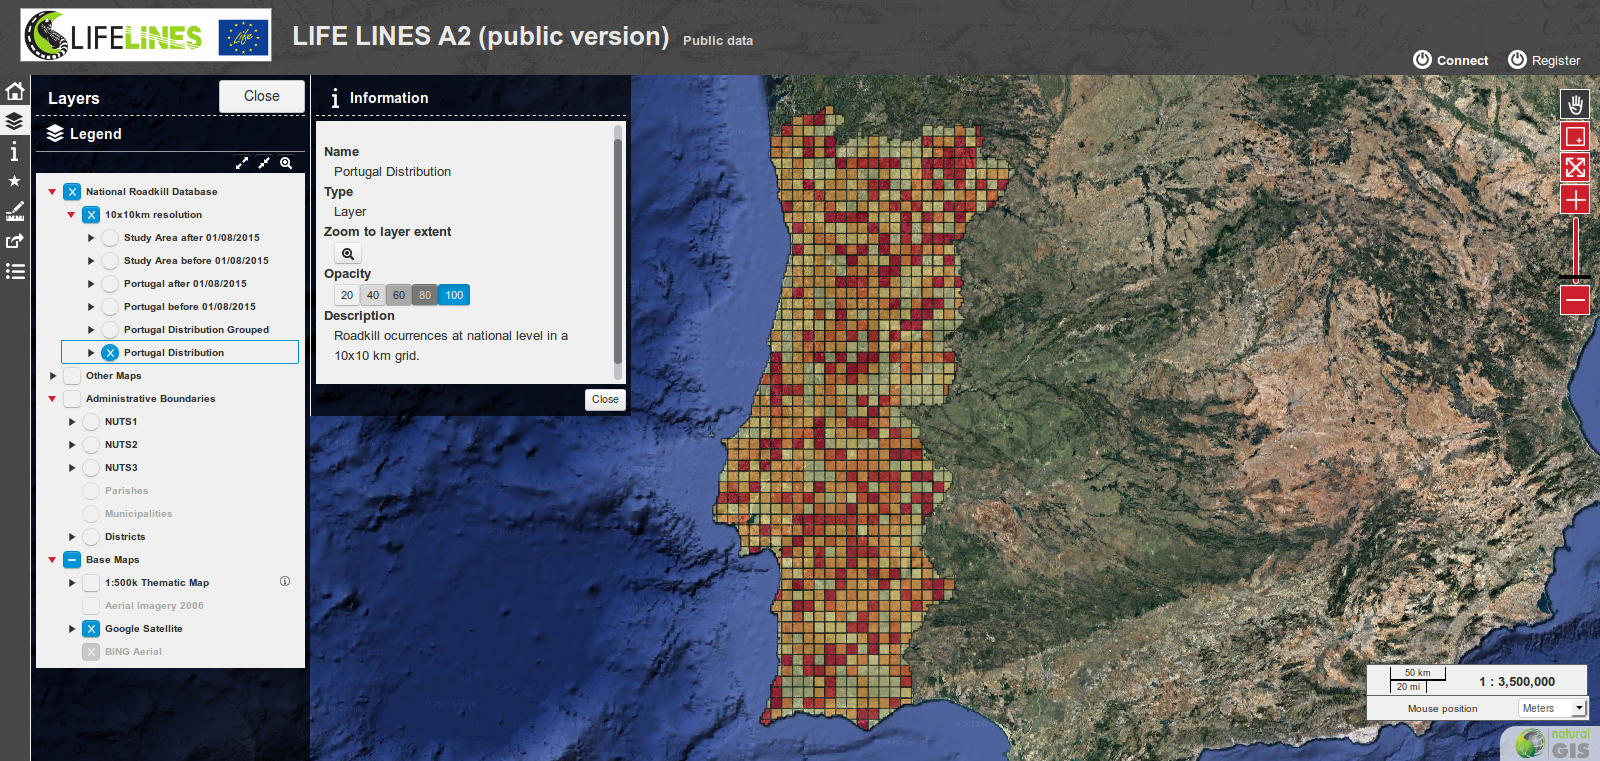
By clicking on any layer in the layers panel this will toggle a secondary panel that will show some information about the layer and will also provide the controls to define the transparency and to perform a zoom (to layer) that will show exactly its full extension.
The right hand vertical toolbar is the NAVIGATION TOOLBAR, and contains the typical tools to allow the user to browse a map. From top to bottom:

- PAN MAP
- ZOOM BY RECTANGLE (the zoom operation can also be performed with the mouse wheel)
- ZOOM TO INITIAL MAP EXTENT
- And two buttons "+" and "-" and a slider control for even more zoom options
The left hand vertical toolbar is the FUNCTION TOOLBAR, and contains a series of very different shortcuts/tools. From top to bottom:

- Return to the viewer landing page
- Toggle and untoggle the “groups/layers” panel
- Toggle and untoggle the "Information" panel
- Activate the "Selection Tool", to perform selection on vector features of a layer
- Activate the "Measures" tools, to allow the user to measure areas and lengths
- PERMALINK URL opens the viewer in a specific state (of scale and toggled/untoggled layers)
- Toggle the "Data" panel, to allow exploration of the attributes table of the vector layers
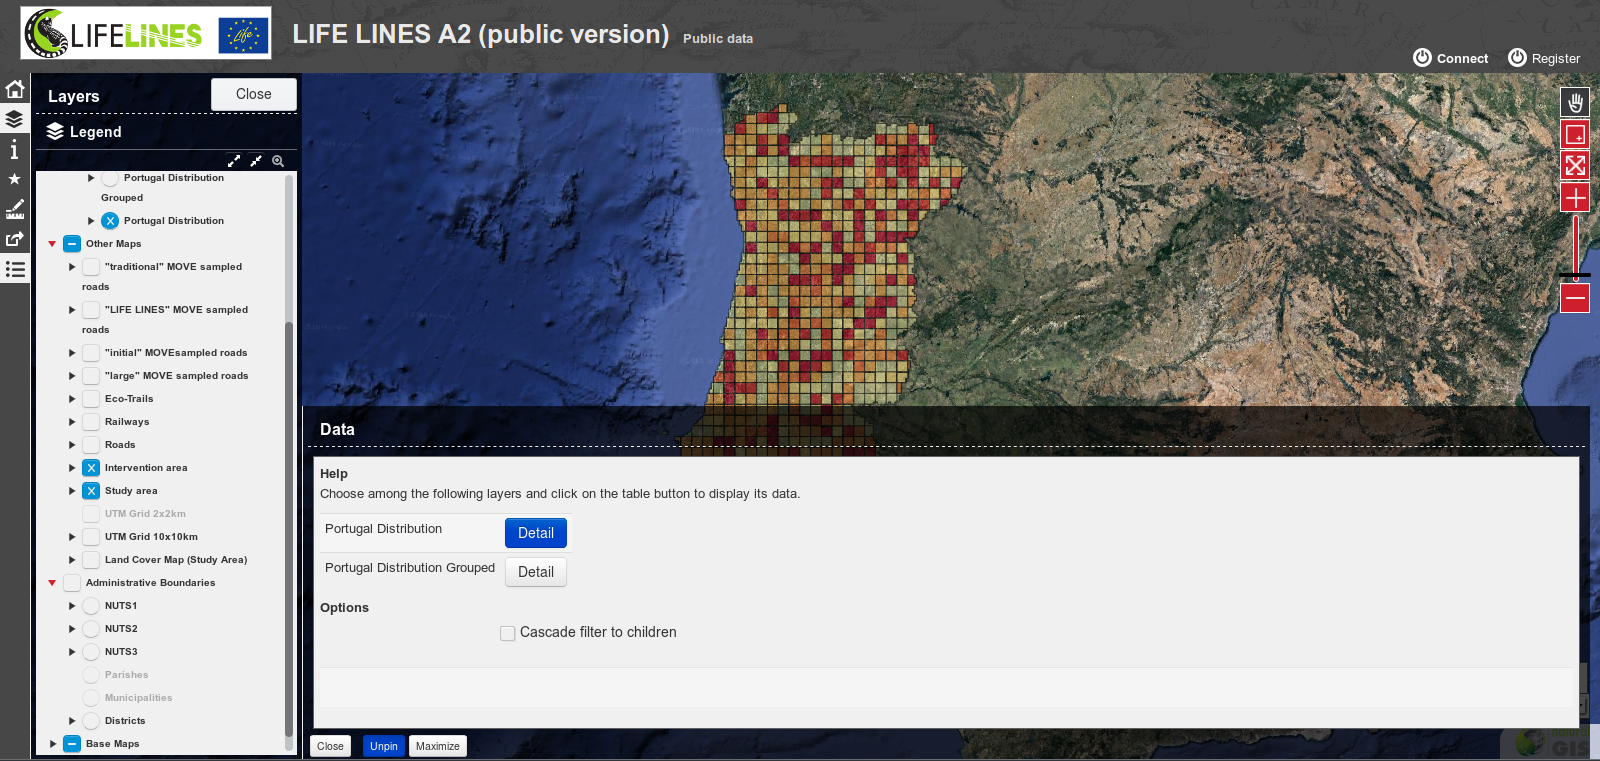
Step3, the data panel: By toggling the data panel is possible to see which layers are available for attributes to be browsed/filtered. First click on "detail" to pull the attributes table of a layer:
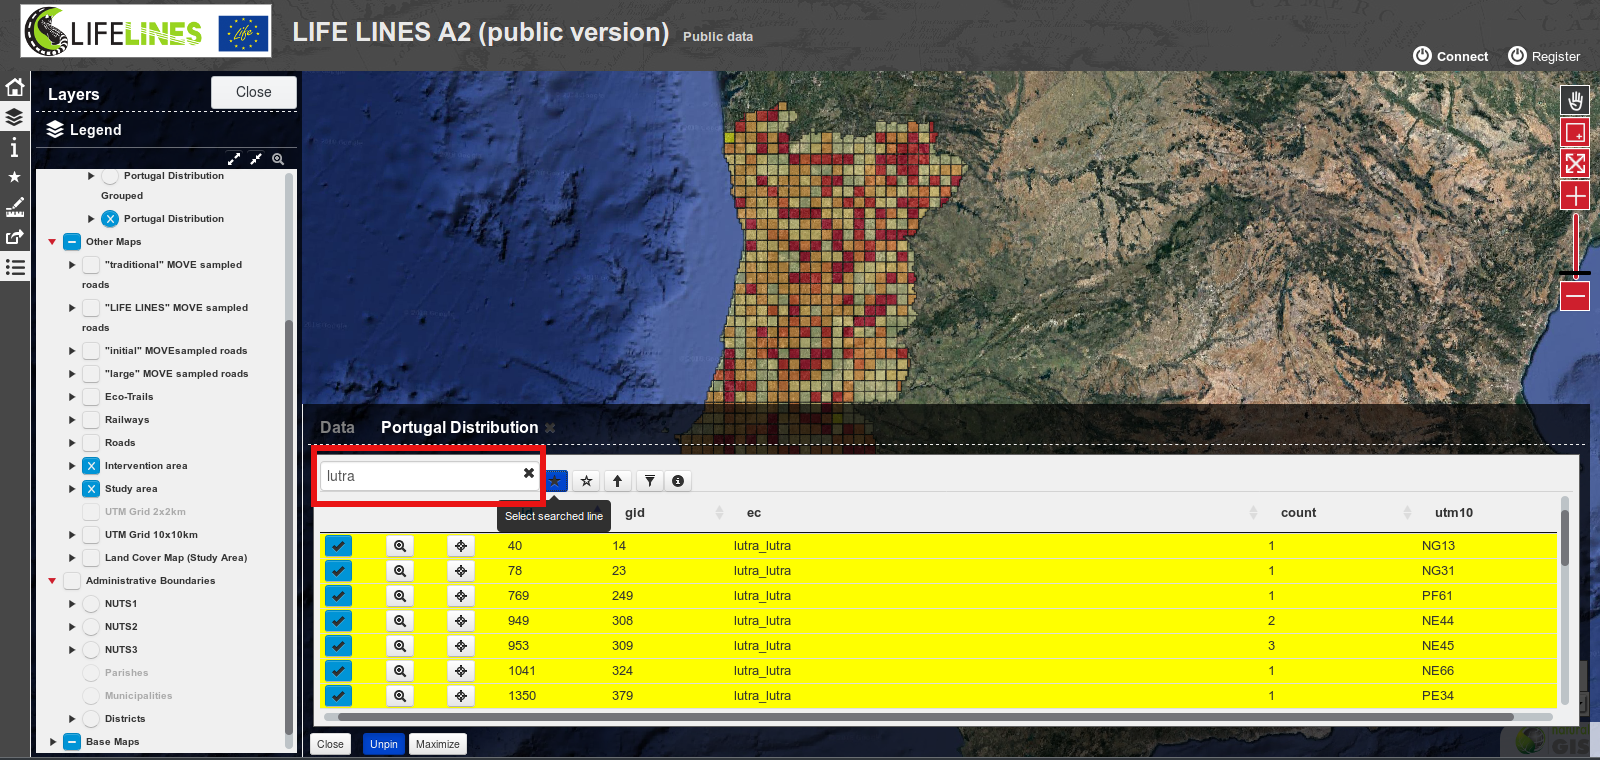
Once the attributes have been pulled, the data can be browsed; columns content reordered, etc. Using the appropriate space (represented in a red frame in the following picture) one or more words can be entered to perform a search within the table. Filtered records can also be selected with the appropriate button:
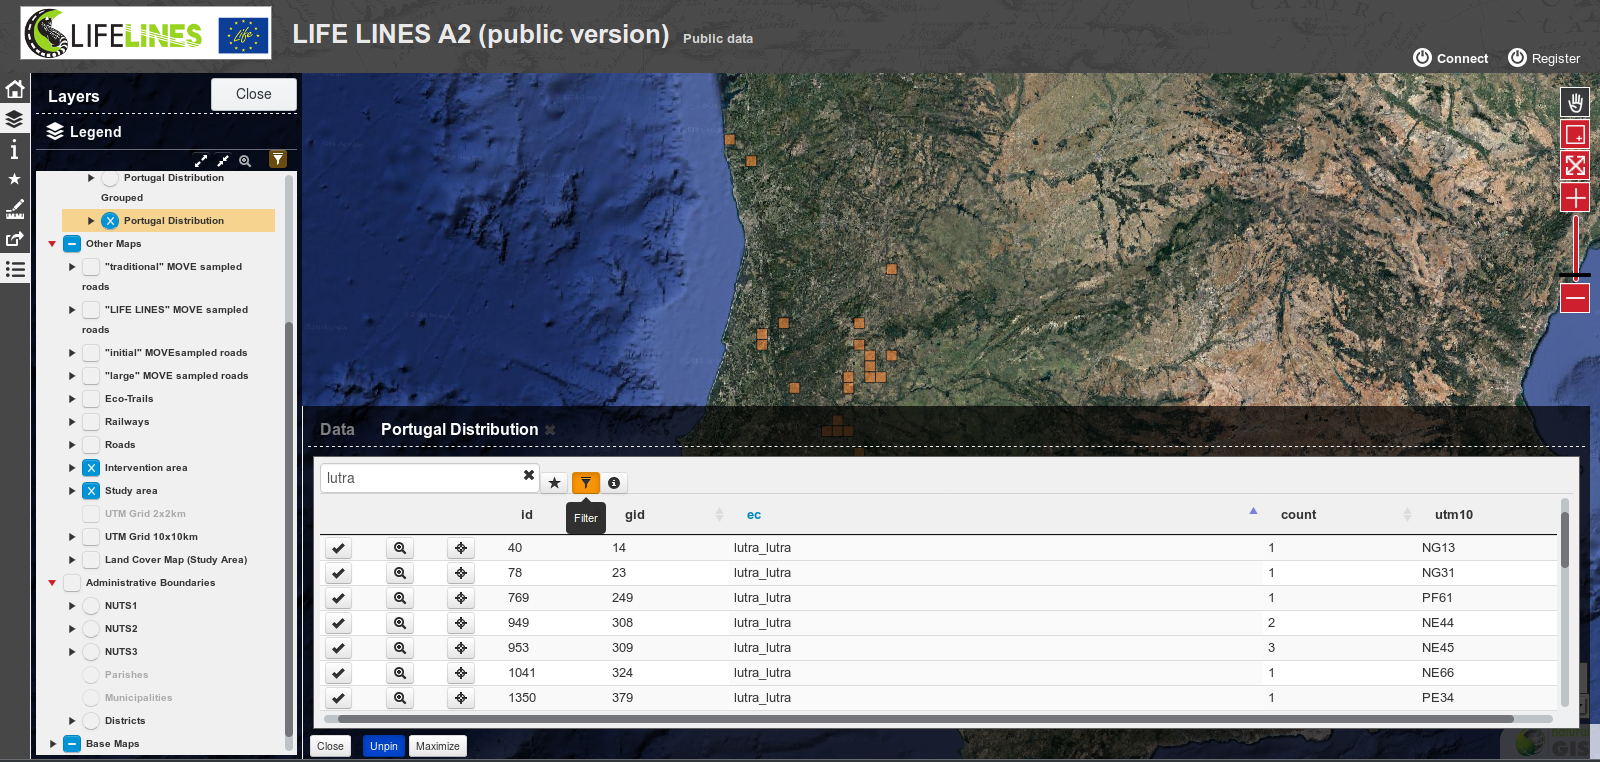
Finally, the selected records can be filtered (on the map) by clicking the "filter" button:
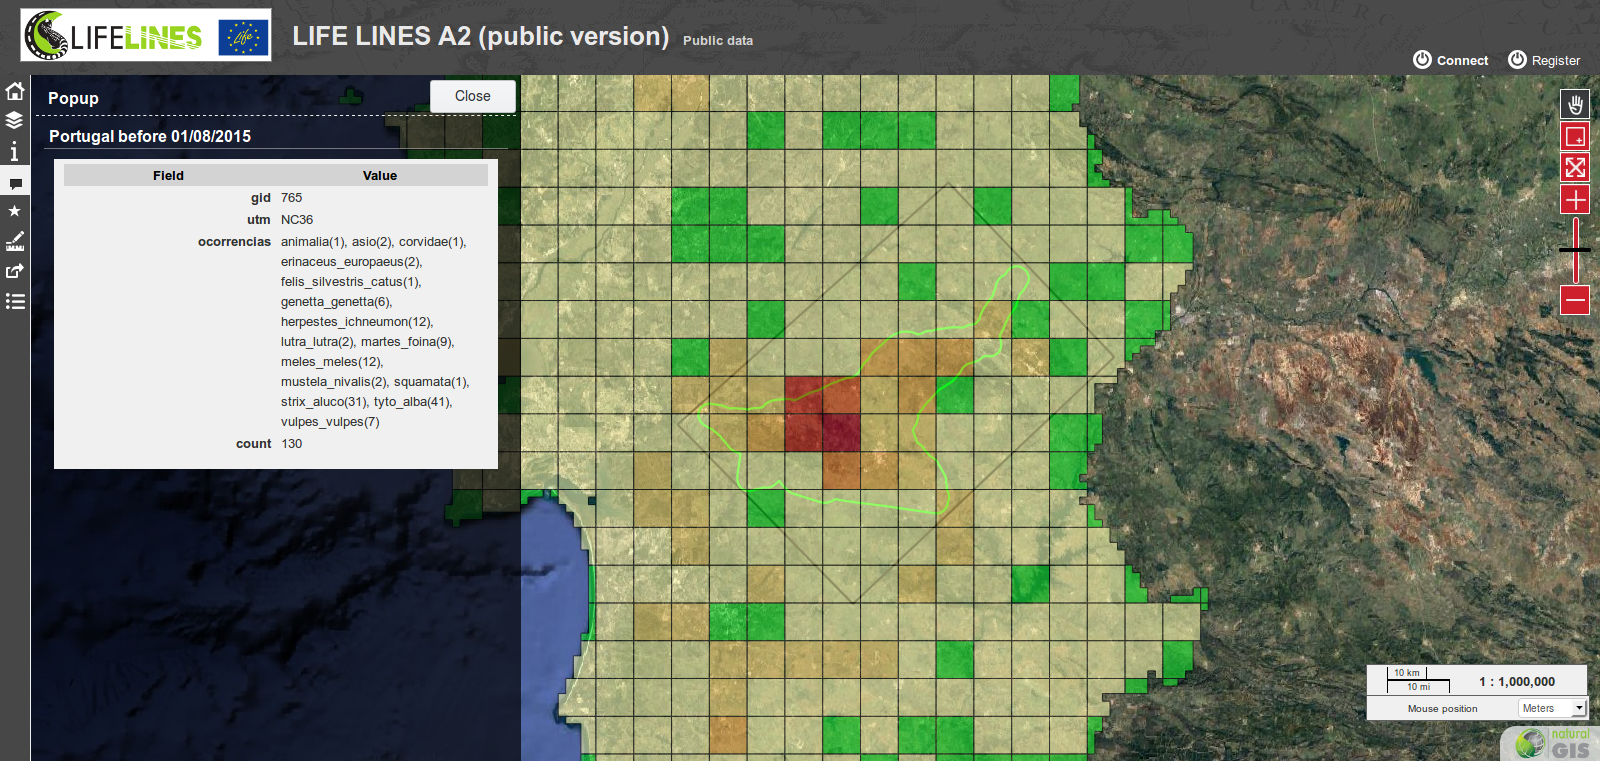
The viewer has NO dedicated IDENTIFY tool, just click on the map and if a layer is identifiable, then a panel with results will pop up
Request project data
Data about species abundance/distribution and road-kills (among the others) will be available in an increasing detail along the duration of the project. Data can be requested to the project managers using the following form.
Download sample data
Bellow you can download some sample of the project's data


